Indian Stock Market: Trend & Reality

  • 91.1% of individual traders (about 73 lakh traders) lost money in the F&O segment in FY24.
  • In FY24 alone, Individuals incurred about ₹75000 crore in net losses.
  • Only 7.2% of Individual F&O traders made a profit over the period of three years.
  • Only 1% of individual traders managed to earn profits exceeding ₹1 lakh, after adjusting for transaction costs in F&O over the period of three years.
  • Individuals incurred more than ₹50,000 crores in transaction costs for trading in F&O during FY22 to FY24. Of which more than half (about ₹25,000 crore) was in the form of brokerage, followed by ₹13,800 crores to the Government in the form of STT, GST and Stamp duty and ₹10,200 crore in the form of Exchange fees.
  • Higher trading activity was associated with a higher percentage of loss-makers.
  • Compared to ‘Male’ traders, less proportion of ‘Female’ traders incurred losses.
  • More than 50% of all the F&O traders, who traded in FY24, were from top four states namely Maharashtra, Gujarat, Uttar Pradesh and Rajasthan.
  • More than 75% of the loss-makers persisted with the trading in F&O, despite making losses in preceding two consecutive years. However, only 8.3% of traders, who persisted to trade in F&O in third year in spite of losses in two preceding years, succeeded to make profit in third year.
  • India’s derivatives market has witnessed remarkable growth since its inception in June 2000, when the National Stock Exchange (NSE) launched trading in Index Futures.
  • The number of Retail traders, or Individual traders (Individuals) have almost doubled in two years from about 51 lakhs in FY22 to about 96 lakhs in FY24.
  • Further, compared to Mutual Fund investors, the number of Individual F&O traders have grown faster.
  • Therefore, this rapid growth in F&O trading activity has once again highlighted the need for investor education and risk management practices, as a significant proportion of retail traders continued to incur losses in the market.
  • Definitions of categories for Section 1 Data
    • Proprietary Traders —— Trading Member, who itself trade in F&O in its own account. (Total 626 Traders only)
    • Individuals —— Individuals, HUF, Proprietorship Firm, Partnership Firm, Limited Liability Partnership Firm (Total 95,75,473 Traders only)
  • It may be noted that the sample of earlier SEBI study was based on Top 10 brokers, whereas that of current study is based on the sample collected from Top 15 brokers.
  • These top 15 brokers account for nearly 90 percent of total individuals
  • Tier I (The following 7 cities considered – Banglore, Delhi, Chennai, Hyderabad, Mumbai, Pune, Kolkata).
  • Tier II (The following 20 cities considered – Amritsar, Bhopal, Bhubaneswar, Chandigarh, Faridabad, Ghaziabad, Jamshedpur, Jaipur, Kochi, Lucknow, Nagpur, Patna, Raipur, Surat, Visakhapatnam, Agra, Ajmer, Kanpur, Mysuru, Srinagar),
  • Tier III (The following 19 cities considered – Etawah, Roorkee, Rajamundry, Bhatinda, Hajipur, Rohtak, Hosur, Gandhinagar, Junagadh, Udaipur, Salem, Jhansi, Madurai, Meerut, Mathura, Bikaner, Cuttack, Vijayawada, Nashik).
  • For computation of profit/loss- realized profit/loss during the period is considered.
  • In FY24, the Proprietary traders’ category earned the highest gross profit (i.e. trading profits before accounting for transaction costs) of about ₹33,000 crore in the equity F&O segment of NSE.
  • While, Individuals made losses in Options to the tune of ~ ₹55,000 crore in FY24, they made profits to the tune of about ~ ₹13,400 crore in Futures.
  • “Others” category, which includes mainly Corporates, NRIs and Trusts, made losses with Algos, but profit without Algos
  • It was observed that the percentage of Individual traders making losses in Futures contracts is constantly lower than those making losses in Options contracts throughout the study period.
  • Individual’s losses in Options segment grew 30.8% year-on-year to ₹77,800 crore in FY24, while they made gains of ₹3,000 crore in Futures (compared to losses of about ₹6,200 crore in FY23).
  • In Futures, individuals made an average net profit of about ₹60,000 per person in FY24, compared to loss of ₹1,28,000 per person in FY23.
  • On an average, Individuals spent ~ ₹ 26,000 per person as a transaction cost in FY24.
  • During FY22 to FY24, there were a total of 1.13 crore unique Individual traders, who traded in F&O at least once during these three years. And, 0.70 lakh traders (or 0.6% traders) traded only Futures.
  • It was observed that higher trading activity was associated with a higher percentage of loss-makers.
  • As traders age increased, the percentage of loss-makers in F&O declined, indicating relative risk aversion, better risk management or the experience coming into play for elderly traders compared to young traders.
  • Low Income: declared annual income less than ₹5 lakh
  • Mid Income: declared annual income between ₹5 lakh to ₹25 lakh
  • High Income: declared annual income less than ₹25 Lakh to ₹ 1 Crore
  • The percentage of loss-makers for “Low Income” traders’ category was the highest (92.2% in FY24)
  • As traders’ annual income increased, the percentage of loss-makers in that category had declined.
  • Compared to ‘Male’ traders, the proportion of ‘Female’ loss-making traders in F&O was lower across the years.
  • In terms of state-wise pattern of average per person loss, it was observed that all the top four states with highest average per person loss were from southern region of India, namely Telangana (1.97 lakh per person loss), followed by Andhra Pradesh (1.45 lakh per person), Tamil Nadu (1.37 lakh per person) and Karnataka (1.35 lakh per person).

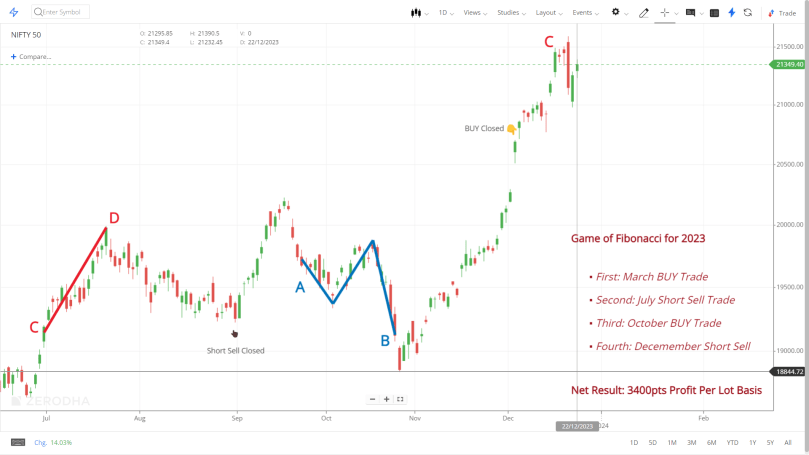
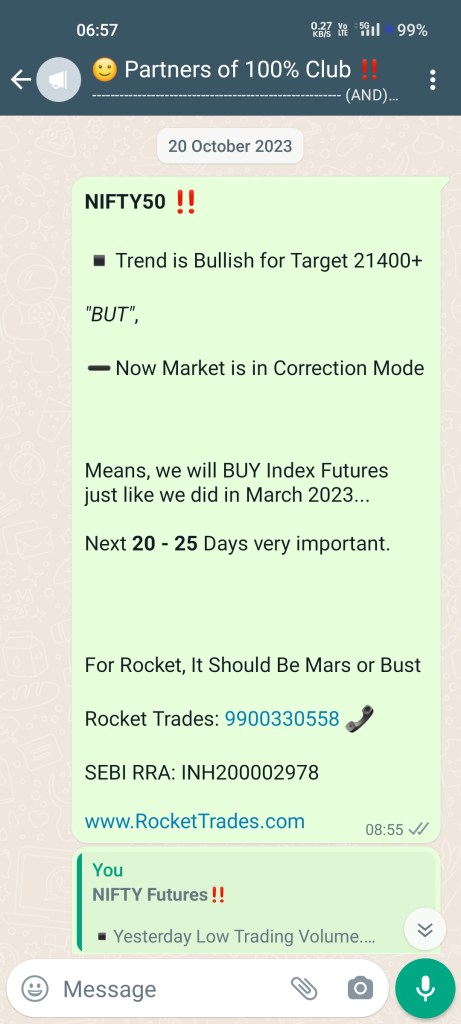
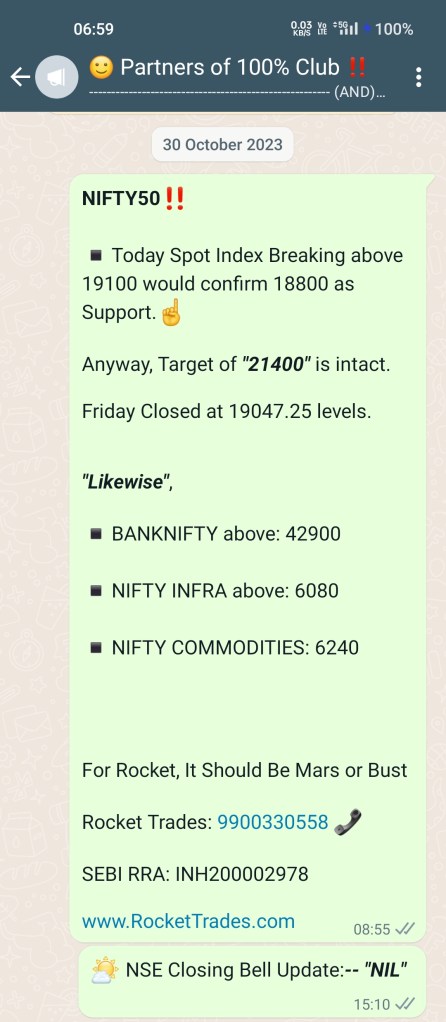
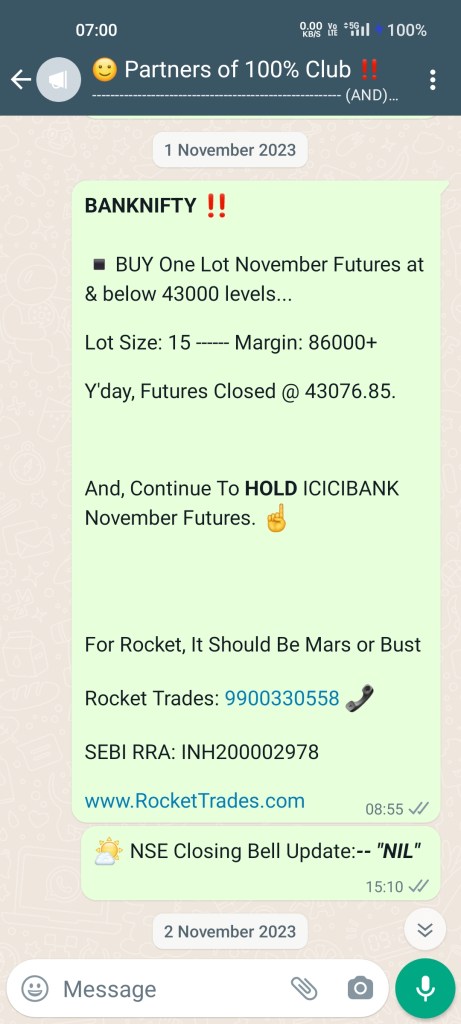
Analysis of Profits & Losses in the Equity Derivatives Segment (FY22 – FY24)

Rocket Trades

We are Strictly fee only Research House armed with proprietary methods & workings.


Call, Text, WhatsApp: +91 99003 30558

Trading Counsel, Support & Guide

SEBI RA: INH200002978, Bengaluru

E-Mail ID: Rocket@RocketTrades.com

BAJAJFINSV —— Follow or Fade or Fight ⁉️

Old tactics simply don’t work in this new age of Stock Market, and both of us (Advisor – Traders) would be wise to recognize this.

Like it or not, this new age is here to stay.

  • Those FOLLOWED Market Volatility incurred loss of 50000
  • Those FADE under Market Volatility – Booked Zero Loss but Zero profit also.
  • And, those who FOUGHT with us, dare Market Volatility finally booked profit of ₹99,000/+

Holding all those 101 days were not easy but worth it if we see the rate of returns.


Originally BAJAJFINSV buy was advised on 24 May 2024 in June Futures at 1620 levels.

Thereafter, Rollovers to July, August and September Futures. 

After all those rollovers the net Cost increased to 1652 from original Cost of 1620.

Originally invested ₹127000/- towards span Margin, which with time increased to ₹160000/- and many days we have seen MTM negative balances. 

However, net result was positive so no harm came to Clients (ofcourse who fought to Market volatility with us) by keeping such a long holding.


Market volatility will not go away. That will always be there. Without that volatility Market can’t and will not function. Because, All profit loss is direct byproducts of that market volatility.

in straight words —— No Volatility No Profit No Loss.Pick your side —— Follow, Fade or Fight. 

IF your decision is to fight then be prepared to lose 30% of your capital. But, reward can also be 100%. Expected Timeline 12 To 18 months.

This BAJAJFINSV trading call is a live example for future that one can see

Loss of ₹50,000/- to profit of ₹1,00,000/- per lot basis, and,

All these in just 101 Calendar Days or 69 Working Days… 

During those 101 days, what not we saw. General Election Results, Budget, Independence Day Speech, Quarterly Results, RBI FOMC Meet, Geopolitical Issues, SEBI vs Hindenburg, etc.

We paid 30pts plus premium for rollovers.

Point is very simple, Market will Move when it want to move. It is not in control of anybody, that means no analyst or analysis method can forecast precise timing each time for one particular instrument or all for that matter.

In this BAJAJFINSV case, from 1520 To 1860, that good 340pts price movement happened in only 12 working days, that is from 16 August 2024 to 2 September 2024. And, on all other working days it was just trading negatively.


Trading or Investment does not Get Rich Quickly scheme or Stock Market is not that easy what has been imagined or made out.

In the same way, the Stock Market is not a bad place.

Your patience and discipline will show whether Stock Market is bad or good for your financial health. 

Lastly, If anyone wants quick positive results then better they should stay out of the Stock Market. 

Because, If we look at the 20-year return of our broad market, it is about 13% plus. If people are coming with 200-300-500% return expectations, then they are likely to be disappointed.


1). All levels are of NSE Cash.

2). Attached Chart is from Zerodha Kite App.

3). This BAJAJFINSV case study is just for the Records and / or educational purposes like all other articles updated on blog till date.

4). Pillars’ Strategy is in-house developed and our core of all the decisions namely BUY, SELL, HOLD.

5). No doubt that BAJAJFINSV indeed closed below our given Stop-loss at 1500 on 4th June 2024 (General Election Results Day) but we didn’t book losses rather advised BUY in NIFTY June Futures at 22080 levels and continued to hold BAJAJFINSV with BANKNIFTY Futures as well.

6). If any reader of this article have any question or doubt about this article or Rocket Trades’ website then please contact Mr Nilesh Jain for the Support, Guidance and / or Clarifications. 


Rocket Trades

We are Strictly fee only Research House armed with proprietary methods & workings.


Call, Text, WhatsApp: +91 99003 30558

Trading Counsel, Support & Guide

SEBI RA: INH200002978, Bengaluru

E-Mail ID: Rocket@RocketTrades.com

NIFTY: 3400pts ➡️ 3 Trades ➡️ 9 Months ‼️

Merry Christmas 🎅🏿 🎄

End of Month, End of Quarter, End of Calendar Year…

Therefore, we feel that New Trend / Correction is Just around the Corner.

(The word “Trend” here does not mean DOWN Trend or Bearish Sentiments).

In last 41 working Days, NIFTY50 has moved from 18800 Levels to 21500+ Levels.

And, to handle this kind of Price Action we need a support of Capital & Risk or Patience.

👇


  • Those who don’t know – With plan of action
  • And, those who don’t know they don’t know – with NO plan of action

We strive to be in camp one. Because, through our rich experience about Market, we understood that Trading (even investing) is game of “known unknowns” and “unknown unknowns”.

AND, there is no Indicator or groups of Indicator of any stream which can give you Full Proof Strategy or Analysis. In other words, 💯% Trading Success is very difficult, if not impossible.


Note:

  • Rajasthan, Madhya Pradesh, Chhattisgarh, Telangana – Assembly Election Results came on Sunday, 3rd November 2023…
  • We advised Entry before Results and took exit immediately after Results, that is on Monday 4th November 2024 at Closing Bell levels… 20800 & 46600 respectively levels.
  • The NIFTY50 Target of 21400 became clear to us when we had to book losses in PIDILITIND but not in ICICIBANK…


  • As of now, we are 100% in Cash – Zero Positions in Stock Futures’ Segment.
  • Just having 1st average of NIFTY & BANKNIFTY December Futures Short Selling Positions.
  • Rolling over to January Expiry on Wednesday 27th December 2023 at Closing Bell levels.
  • And, Now, Watching for NIFTY50 to Either hit 20000 or 22200 plus levels. Till then waiting patiently. Because, 👇

Rocket Trades

We are Strictly fee only Research House armed with proprietary methods & workings.


Call, Text, WhatsApp: +91 99003 30558

Trading Counsel, Support & Guide

SEBI RA: INH200002978, Bengaluru

E-Mail ID: Rocket@RocketTrades.com