If you believe in India’s long-term potential, consider buying the stocks listed in Table One. India’s talent of solving problem and innovation makes it a wise choice. The current prices make it a favorable investment. This holds true even amid strong selling pressure from foreign institutional investors.
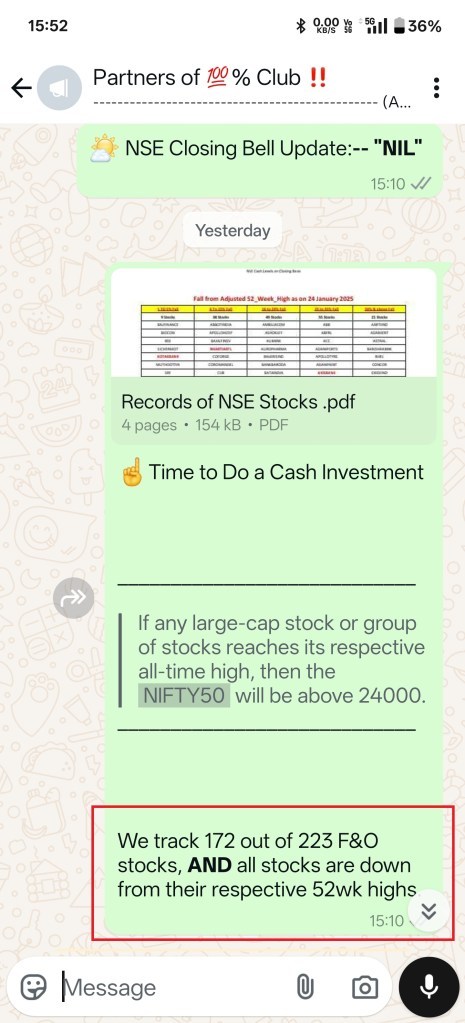
Screen Shot of WhatsApp Messages Sent to the Clients
We had updated 28000 To 31000 Target on the Last working day of Calendar Year 2024 🙂🙏🏽
Table “ONE”
SL
Name of the Stock
Number of Shares to be Bought
NSE Closing Price As on 24 January 2025
1
AXISBANK
105
948.5
2
BHARTIARTL
61
1644.8
3
HDFCBANK
61
1649.8
4
HINDUNILVR
42
2368.1
5
ICICIBANK
83
1209.2
6
IDFCFIRSTB
1606
62.27
7
INDUSINDBK
105
950.8
8
INFY
53
1875.45
9
ITC
226
441.6
10
JIOFIN
409
244.45
11
KOTAKBANK
53
1886.2
12
LICI
122
821.25
13
LT
29
3458.2
14
RELIANCE
80
1246.3
15
SBIN
134
744.15
16
SIEMENS
17
5879.7
17
TATASTEEL
771
129.74
18
TCS
24
4152.35
Total Investing Amount
1798916.86
Please Note:
This is recommended to allocate same amount of Investment in above-mentioned each Stocks respectively.
Exit is only at & above 28000 NIFTY50 Levels or whenever Down-Trend Starts.
Anyway, we will update Exit as well. Continue to hold in all situations & Conditions.
If you prefer then trade in Futures and keep Rolling Over.
Rolling Over will Increase Exposure Cost but will save Interest on Capital Invested. Trade-Off. But, Return On Investment will be much better.
We have taken 100000 as Standard Investment amount. You can take 1,000 or 10,000 or 10,00,000.
If everything goes according to our Research then one can expect 50%+ Returns by next year’s Budget.
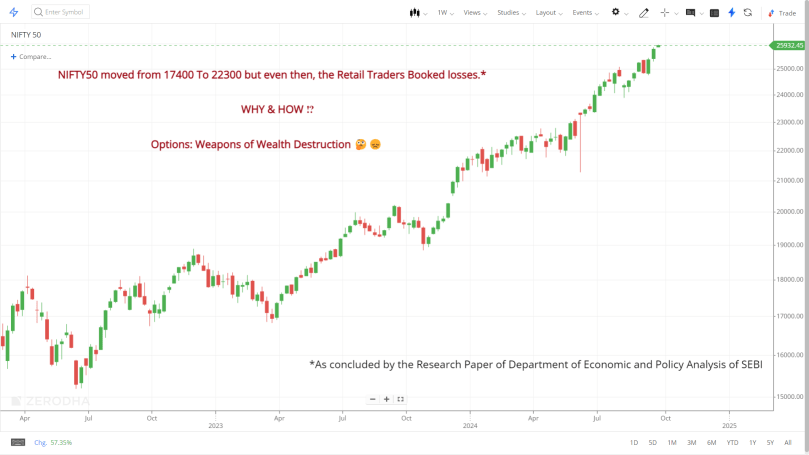
NIFTY50 is trading near June Top (before General Election Result day) and November 2024 Bottom. We feel the Market has seen its worst. But still we are keeping our finger crossed. 🤞🤞🤞
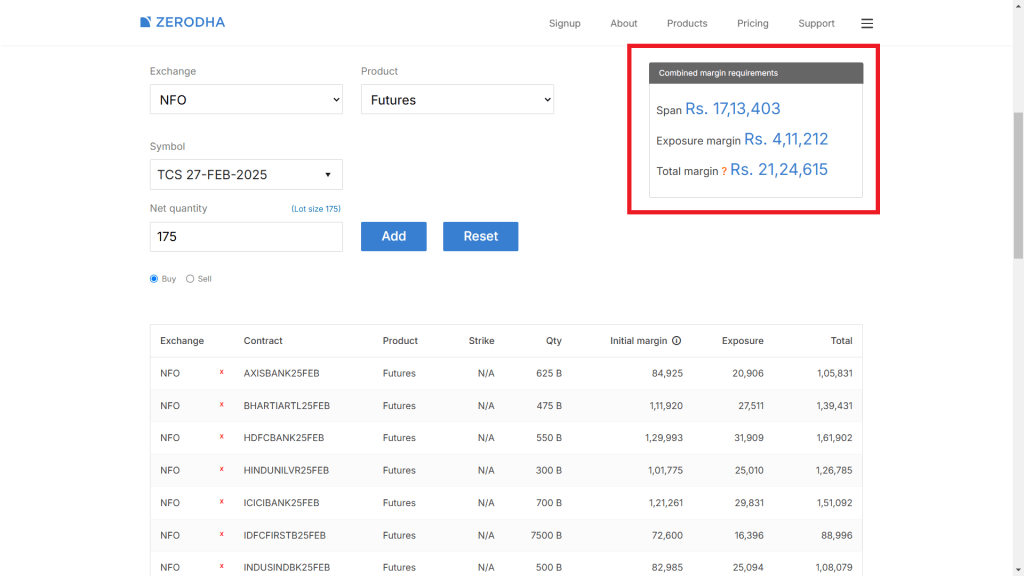
If above-mentioned Stocks are to be taken in the Futures then total Margin Required will be around “21lac” and plus Mark to Margin
👇
Rocket Trades
We are Strictly fee only Research House armed with proprietary methods & workings.
We are improvising our trading strategy and working methodology every single day to achieve the target of ₹100 Crores from ₹20lac Capital in the next 21 To 24 Years…
Because, we are only “22” years away from our 100th Independence Day.
The NIFTY50 traveled from 5200 to 25200 levels from September 2013 To September 2024, period of 11 years. Therefore, by that logic, this is very much possible to see NIFTY50 from present 26000 levels to 51000++ levels by 2035…
But, rest assured there will be bear Markets in between. DO NOT MISS THE “BOTTOM“ 🙂🙏🏽
How we will be doing this
Best Strategy to do so is be a Buyer at each & every crisis, no over trading or options or Intraday, trading without Stop-loss should be avoided at all cost, withdrawal of funds for any reason or purpose is not recommended, don’t follow particular prevailing market theme or fashion, don’t short sell anything which has limited supply or going to be in a short supply rather be a buyer for that even at an all-time high.
And, most importantly, this (₹100 Crore Target) will be never possible without leverage, patience and discipline. Though not compulsory but time to time addition of capital is always helpful, even for temporary or short-term basis.
The core of everything we do at Rocket Trades is transparency. And, because of this reason we are updating every profit and loss to our clients on our website from day one with WhatsApp Screenshot.
This is where things become interesting…
When it comes to producing real prosperity, manipulating money is never the answer.
Past Performance is no guarantee for future performance.
Please understand that 30% risk will always be there on Capital or Fund or Account Size.
Generating Profit is a sole purpose of our existence. But, In any sense, we are not offering any kind of profit guarantee.
As of now, we are only a independent Research House registered with the SEBI. But, in future our organization’s structural status can change. For Example: Our next stage of growth to become a Portfolio Management Company, however Ownership will not change, nor the Management.
As of now, we have in house developed four Trading strategies. And, they are: Pillars’ Strategy, Game of Fibonacci, VIXNOMICS, and Major Minor Strategy. Improvisation to better alignment with the Market of above-mentioned strategies are ongoing and we promised to ourselves that will never be stopped.
As of now, we are tracking only top 160 derivatives Stocks of NSE, and NIFTY, BANKNIFTY, and MCX Silver, only.
₹100 Crores is a Gross amount,excluding of all Government related Taxes, Broker & Trading Related Expenses and Research & advisory related Expenses.
Next review will be updated in the first week of April 2029 —— that is exactly after 9 years from the NIFTY50 bottom driven by COVID-19 crisis to ascertain our consistency and transparency.
Trading is a risk preposition therefore not recommended for everyone. Only those should do trading who can comfortably bear Market Risk, pressure and tension of capital loss, and that to without compromising their personal life and health.
We will be moving in sync of Fibonacci Sequence, that is: 0, 1, 1, 2, 3, 5, 8, 13, 21, 34, 55, 89, 144, 233, 377, 610, 987, 1597, 2584, 4181… To achieve our intended Target of ₹100 Crore. We are assuming to achieve to next sequence number on an average in 18 months.
Do it yourself:
HOLD some cash and prepare yourself psychologically, so you have the gumption to deploy it when there’s blood in the streets.
Some of the past examples and recall what happened thereafter,
Dot.com Bubble Burst in 2000
Subprime Mortgage Bubble Burst in 2008
COVID-19 driven Sell Off in 2020
The Market had many falls (price correction, profit bookings) in between as well. But each time mainly because of international news, events, happenings. Quick Fall Quicker Recovery.
That the future is uncertain. Therefore, one must always remain cautious and prepared for unexpected events.
Few Words for the beginners:
The problem is that Inexperienced analyst only focuses on recent price chart history – and not “in context” (as we love to say). Context is particularly important when it comes to analyzing Market Movements via technical analysis – as their narrative collapses when looking at a long enough timeline.
Rocket Trades
We are Strictly fee only Research House armed with proprietary methods & workings.
Please Check 10 February & 13 March 2023 WhatsApp messages. Profit achieved 1,30,000/- on 100 QYT of NIFTY Futures is not added in the performance of 2023. ↩︎
Please check 31 January and 25 July 2024 messages about SILVER. The 1,74,000/- Booked Profit per lot basis of SILVER is not added here. ↩︎
91.1% of individual traders (about 73 lakh traders) lost money in the F&O segment in FY24.
In FY24 alone, Individuals incurred about ₹75000 crore in net losses.
Only 7.2% of Individual F&O traders made a profit over the period of three years.
Only 1% of individual traders managed to earn profits exceeding ₹1 lakh, after adjusting for transaction costs in F&O over the period of three years.
Individuals incurred more than ₹50,000 crores in transaction costs for trading in F&O during FY22 to FY24. Of which more than half (about ₹25,000 crore) was in the form of brokerage, followed by ₹13,800 crores to the Government in the form of STT, GST and Stamp duty and ₹10,200 crore in the form of Exchange fees.
Higher trading activity was associated with a higher percentage of loss-makers.
Compared to ‘Male’ traders, less proportion of ‘Female’ traders incurred losses.
More than 50% of all the F&O traders, who traded in FY24, were from top four states namely Maharashtra, Gujarat, Uttar Pradesh and Rajasthan.
More than 75% of the loss-makers persisted with the trading in F&O, despite making losses in preceding two consecutive years. However, only 8.3% of traders, who persisted to trade in F&O in third year in spite of losses in two preceding years, succeeded to make profit in third year.
India’s derivatives market has witnessed remarkable growth since its inception in June 2000, when the National Stock Exchange (NSE) launched trading in Index Futures.
The number of Retail traders, or Individual traders (Individuals) have almost doubled in two years from about 51 lakhs in FY22 to about 96 lakhs in FY24.
Further, compared to Mutual Fund investors, the number of Individual F&O traders have grown faster.
Therefore, this rapid growth in F&O trading activity has once again highlighted the need for investor education and risk management practices, as a significant proportion of retail traders continued to incur losses in the market.
Definitions of categories for Section 1 Data
Proprietary Traders —— Trading Member, who itself trade in F&O in its own account. (Total 626 Traders only)
It may be noted that the sample of earlier SEBI study was based on Top 10 brokers, whereas that of current study is based on the sample collected from Top 15 brokers.
These top 15 brokers account for nearly 90 percent of total individuals
Tier I (The following 7 cities considered – Banglore, Delhi, Chennai, Hyderabad, Mumbai, Pune, Kolkata).
Tier II (The following 20 cities considered – Amritsar, Bhopal, Bhubaneswar, Chandigarh, Faridabad, Ghaziabad, Jamshedpur, Jaipur, Kochi, Lucknow, Nagpur, Patna, Raipur, Surat, Visakhapatnam, Agra, Ajmer, Kanpur, Mysuru, Srinagar),
Tier III (The following 19 cities considered – Etawah, Roorkee, Rajamundry, Bhatinda, Hajipur, Rohtak, Hosur, Gandhinagar, Junagadh, Udaipur, Salem, Jhansi, Madurai, Meerut, Mathura, Bikaner, Cuttack, Vijayawada, Nashik).
For computation of profit/loss- realized profit/loss during the period is considered.
In FY24, the Proprietary traders’ category earned the highest gross profit (i.e. trading profits before accounting for transaction costs) of about ₹33,000 crore in the equity F&O segment of NSE.
While, Individuals made losses in Options to the tune of ~ ₹55,000 crore in FY24, they made profits to the tune of about ~ ₹13,400 crore in Futures.
“Others” category, which includes mainly Corporates, NRIs and Trusts, made losses with Algos, but profit without Algos
It was observed that the percentage of Individual traders making losses in Futures contracts is constantly lower than those making losses in Options contracts throughout the study period.
Individual’s losses in Options segment grew 30.8% year-on-year to ₹77,800 crore in FY24, while they made gains of ₹3,000 crore in Futures (compared to losses of about ₹6,200 crore in FY23).
In Futures, individuals made an average net profit of about ₹60,000 per person in FY24, compared to loss of ₹1,28,000 per person in FY23.
On an average, Individuals spent ~ ₹ 26,000 per person as a transaction cost in FY24.
During FY22 to FY24, there were a total of 1.13 crore unique Individual traders, who traded in F&O at least once during these three years. And, 0.70 lakh traders (or 0.6% traders) traded only Futures.
It was observed that higher trading activity was associated with a higher percentage of loss-makers.
As traders age increased, the percentage of loss-makers in F&O declined, indicating relative risk aversion, better risk management or the experience coming into play for elderly traders compared to young traders.
Low Income: declared annual income less than ₹5 lakh
Mid Income: declared annual income between ₹5 lakh to ₹25 lakh
High Income: declared annual income less than ₹25 Lakh to ₹ 1 Crore
The percentage of loss-makers for “Low Income” traders’ category was the highest (92.2% in FY24)
As traders’ annual income increased, the percentage of loss-makers in that category had declined.
Compared to ‘Male’ traders, the proportion of ‘Female’ loss-making traders in F&O was lower across the years.
In terms of state-wise pattern of average per person loss, it was observed that all the top four states with highest average per person loss were from southern region of India, namely Telangana (1.97 lakh per person loss), followed by Andhra Pradesh (1.45 lakh per person), Tamil Nadu (1.37 lakh per person) and Karnataka (1.35 lakh per person).


You must be logged in to post a comment.