Greetings !!
Did our headline surprise you ? It shouldn’t be…
Here are the Six reasons with Six charts why this was no surprise at all.
First). Falling Currency Value: USDINR depreciation helps in increasing Earning per shares for Exporters like OIL, IT, TEXTILE & MNC Subsidiaries in FMCG, PHARMA and likewise.
Secondly who needs logic in PE Calculations in the World of Tesla, where,

But remember nothing crashes P/E Multiples faster than a jump in Inflation. And to measure Inflation you need to keep eye on Interest rates, which of course ultralow at present.
Second). Falling Interest Rates gives negative returns, if one counts inflation in their total calculations, to Fixed Depositors therefore Equity Investments looks great, at-least on paper.
However, attached images shows possible increase in Interest Rates. Golden Crossover.

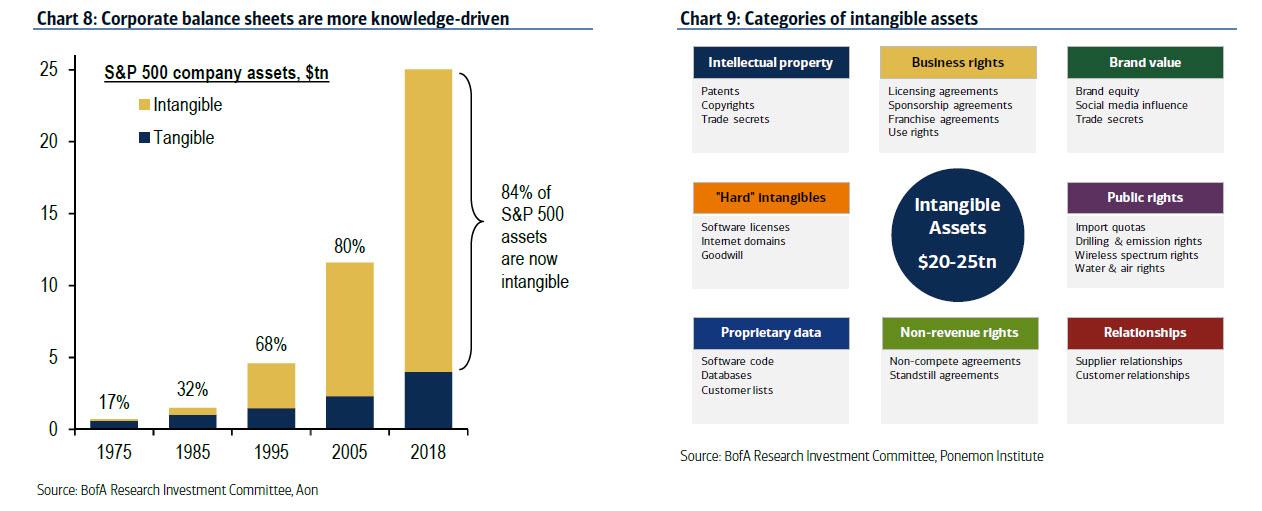
Third). Falling Real Assets shares’ in total Market Capitalization; intangibles like Patent & Licenses, Goodwill & Brand Value, Software Codes are all too easy to inflate in values as there is no standard / universal metrics to value them.
Four). Time to time Governmental Interventions in form of Stimulus, Bailouts and via it’s regulatory agency like SEBI, RBI
Fifth). Apple, Microsoft, Google, Facebook, Amazon and many mores like them are single player Industry leaders. There is no substitute / competition for them. So, there Stock has to be in every Portfolio, Mutual Fund and ETF Scheme/s. Therefore, no Seller.
In Indian Context RELIANCE is one via businesses like Oil, Telecom, Retail and who knows Bank business may also get added in their fold in near future.
Sixth). Share Buy Backs by company themselves – For Example, Over the past 10 years, US corporates have spent around $9.2 TRILLIONS (Indian GDP is less than 3 trillion) buying back their own stock – money wasn’t spent on building new factories, infrastructure, products or creating jobs but boosting the bonuses of executives and dividends to owners.
Put all these together and you get what a true Bull required to take NIFTY50 @ 23000
However, we don’t believe given all the Fundamental and Technical proofs, few of them are,
~ AB=CD Pattern achieved Target around 12500
~ 200MA Deviation is more than 22%
~ Highest PE Ratio near about 36
Most Importantly, what NIFTY50 is doing now in November 2020 is exactly what we saw happening during March 2020 but in opposite direction
Back then vertical Fall with multiple unfiled Gap-Downs; NOW vertical Rise with Multiple unfiled Gap-ups. Eight in Total. Sixteen plus if counted both side.
Hopefully, you notice the similarity and understood the Market Message.
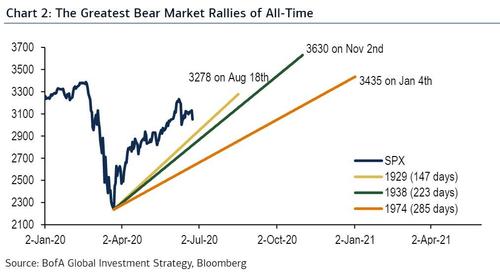
Secondly, attached chart depict that S&P500 is still in Bear Market Rally.
Price wise levels have come & gone. Waiting for Time wise that is 1st week of Jan 2021
We expect NIFTY50 to give one big fall (correction / down trend) before resuming up-trend.
Closing Remarks:
We are inherently bullish but not blindfolded.
Hardly, there was any one who was So Bullish on Market like we were back then.
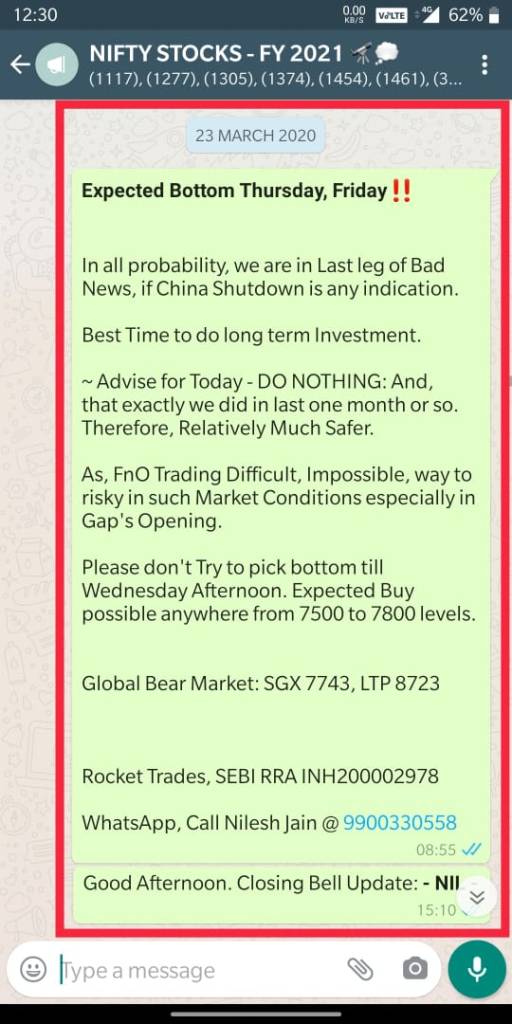
NIFTY50 made Bottom @ 7511 next day on 24 March 2020
There is another record of our Bullishness back then, visit following URL for more,
https://rockettrades.com/2020/03/18/correction-recession-depression/
Thank You for Reading.

Rocket Trades
Call, Text: +91 99003 30558
Nilesh Jain, Trading Counselor
SEBI RA: INH200002978, Bengaluru
E-Mail ID: Rocket@RocketTrades.com

You must be logged in to post a comment.